The analytics industry has been experiencing significant growth in recent years. As businesses seek to gain a competitive advantage, the need for data-driven insights has become more critical than ever before. With advances in technology and more accessible data sources, the analytics industry is constantly evolving to meet the needs of businesses across various sectors.
From predictive analytics to artificial intelligence, the latest trends and developments in the analytics industry are changing the way businesses operate. As a result, it’s essential for business leaders and data professionals to stay up-to-date with the latest trends and developments in this rapidly evolving industry.
In this article, we’ll explore some of the most significant trends and developments in the analytics industry, including the rise of machine learning, the increasing importance of data privacy, and the emergence of new analytics tools and techniques.
Importance of staying up-to-date with the latest trends and developments
Staying up-to-date with the latest trends and developments is crucial for individuals and businesses to remain competitive and relevant in today’s fast-paced world. Whether in technology, marketing, or any other industry, the ability to adapt and innovate is critical to success.
By keeping up with the latest trends and developments, individuals and businesses can identify new opportunities, stay ahead of the competition, and meet the evolving needs of their customers.
For instance, staying up-to-date with the latest trends and developments in digital marketing can help businesses remain relevant and effective in reaching their target audience. With the constant evolution of social media algorithms, search engine optimization techniques, and content marketing strategies, businesses that stay informed and adapt to these changes can gain a competitive advantage and achieve their marketing goals.
Similarly, staying up-to-date with the latest trends and developments is essential in the technology industry to remain relevant and competitive. For example, businesses that keep up with the latest advancements in artificial intelligence, machine learning, and cloud computing can leverage these technologies to streamline operations, improve customer experiences, and gain a competitive edge.
Staying up-to-date with the latest trends and developments is critical for individuals and businesses to remain competitive, innovative, and successful in today’s ever-changing world.
The benefits of implementing new analytics trends and developments
Implementing new analytics trends and developments can benefit businesses of all sizes significantly, allowing them to make more informed decisions, optimize operations, and improve their overall performance. Here are some key benefits of implementing new analytics trends and developments:
- Improved decision-making: New analytics trends and developments enable businesses to gather and analyze data in real-time, providing insights into customer behavior, market trends, and other critical factors. This information can help companies to make data-driven decisions that are more accurate and effective.
- Increased efficiency: New analytics technologies, such as machine learning and automation, can help businesses automate repetitive tasks, streamline operations, and reduce the risk of errors. This can help companies to save time and money and increase their overall efficiency.
- Better customer experiences: By analyzing customer data, businesses can gain insights into customer preferences, behavior, and needs, allowing them to personalize their products, services, and marketing efforts. This can lead to better customer experiences, increased loyalty, and higher retention rates.
- Competitive advantage: Implementing new analytics trends and developments can give businesses a competitive advantage by enabling them to stay ahead of their competitors, identify new opportunities, and quickly respond to market changes.
- Improved revenue: By analyzing customer data, businesses can identify new revenue opportunities, optimize pricing strategies, and increase their overall revenue. Additionally, by improving customer experiences, companies can attract new customers and increase their lifetime value.
Implementing new analytics trends and developments can benefit businesses significantly, allowing them to make more informed decisions, optimize operations, and improve their overall performance.
Artificial Intelligence and Machine Learning
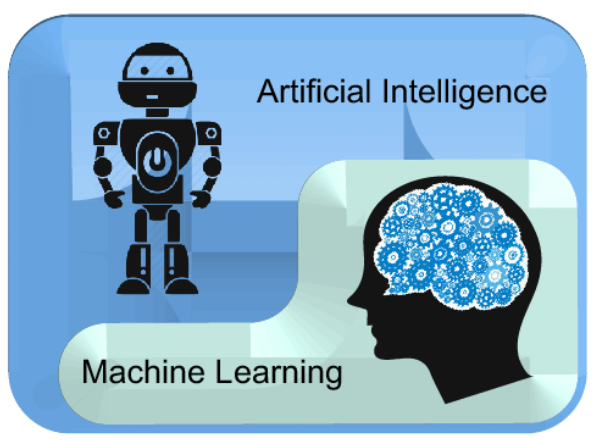
Artificial Intelligence (AI) and Machine Learning (ML) are two of the most transformative technologies of our time. AI refers to developing intelligent computer systems that can perform tasks that typically require human intelligence, such as speech recognition, decision-making, and language translation. Conversely, ML is a subset of AI that involves training algorithms to learn from data, allowing machines to improve their performance over time without being explicitly programmed.
AI and ML applications are vast, transforming many industries, including healthcare, finance, retail, and transportation. For example, AI and ML are used in healthcare to analyze patient data, improve diagnosis accuracy, and develop personalized treatment plans. AI and ML analyze financial data, detect fraud, and make more accurate predictions in finance.
In marketing, AI and ML are revolutionizing how businesses interact with customers. By analyzing customer data, AI and ML algorithms can identify patterns and preferences, allowing companies to create more personalized and targeted marketing campaigns. Additionally, AI-powered chatbots and virtual assistants transform customer service, enabling businesses to provide 24/7 support and improve customer satisfaction.
The applications of AI and ML are vast and constantly expanding. These technologies can revolutionize many aspects of our lives and transform industries in ways we never thought possible. As we continue to advance in this field, we can expect to see even more exciting and innovative applications of AI and ML.
What are artificial intelligence (AI) and machine learning (ML)?
Artificial Intelligence (AI) refers to developing computer systems that can perform tasks that typically require human intelligence, such as perception, reasoning, learning, and decision-making. AI systems can be designed to interact with the environment and learn from experience, allowing them to improve their performance over time.
Machine Learning (ML) is a subset of AI that involves training algorithms to learn from data without being explicitly programmed. ML algorithms use statistical techniques to identify patterns in data, enabling them to make predictions or decisions based on that data. ML allows computers to learn and improve their performance on a task without being explicitly programmed to do so.
There are three main types of ML: supervised learning, unsupervised learning, and reinforcement learning.
- In supervised learning, the algorithm is trained on labeled data, meaning the correct output is provided for each input.
- In unsupervised learning, the algorithm is trained on unlabeled data and must identify patterns or relationships independently.
- In reinforcement learning, the algorithm learns by interacting with an environment and receiving rewards or penalties for specific actions.
AI and ML have numerous applications in many industries, including healthcare, finance, transportation, and marketing. These technologies can potentially revolutionize how we live and work, improving efficiency, accuracy, and decision-making. As AI and ML continue to evolve, we can expect to see even more exciting and innovative applications.
How are AI and ML being used in the analytics industry?
AI and ML are transforming the analytics industry by enabling businesses to make more accurate predictions, optimize operations, and gain valuable insights from data. Here are some of how AI and ML are used in the analytics industry:
- Predictive analytics: AI and ML algorithms can analyze historical data and identify patterns to predict future events or trends. This can help businesses make more informed decisions and improve their overall performance.
- Natural Language Processing (NLP): NLP is a subset of AI that allows computers to analyze and understand human language. NLP algorithms can extract insights from unstructured data sources, such as customer reviews or social media posts.
- Fraud detection: AI and ML algorithms can analyze large amounts of data to detect fraudulent activities and prevent financial losses.
- Recommendation engines: AI and ML algorithms can analyze customer data to make personalized product or content recommendations, improving the customer experience and increasing engagement.
- Supply chain optimization: AI and ML algorithms can analyze supply chain data, identify improvement areas and optimize processes to reduce costs and increase efficiency.
- Sentiment analysis: AI and ML algorithms can analyze social media or customer feedback to determine customer sentiment and identify areas for improvement.
AI and ML are transforming the analytics industry, enabling businesses to make more informed decisions, optimize operations, and gain valuable insights from data. We can expect to see even more innovative and exciting applications as these technologies evolve.
Benefits and challenges of implementing AI and ML in analytics
Implementing Artificial Intelligence (AI) and Machine Learning (ML) in analytics have the potential to provide numerous benefits, but they also present some challenges. Here are some of the key benefits and challenges of implementing AI and ML in analytics:
Benefits:
- Increased accuracy and efficiency: AI and ML algorithms can analyze data more quickly and accurately than humans, enabling businesses to make more informed decisions and improve their overall performance.
- Personalization: AI and ML algorithms can analyze customer data to make personalized product or content recommendations, improving the customer experience and increasing engagement.
- Cost savings: AI and ML can reduce costs and increase efficiency by automating repetitive tasks and optimizing processes.
- Scalability: AI and ML algorithms can analyze large amounts of data at scale, providing businesses with previously impossible insights.
Challenges:
- Data quality: AI and ML algorithms rely on high-quality data to produce accurate results. Data quality can lead to accurate predictions or decisions.
- Lack of transparency: AI and ML algorithms can be complex, making it difficult for humans to understand how they arrived at a particular decision.
- Bias: AI and ML algorithms can be biased if trained on data not representative of the population.
- Security and privacy: AI and ML algorithms can be vulnerable to security threats, and businesses must take steps to ensure that sensitive data is protected.
Implementing AI and ML in analytics has the potential to provide significant benefits. Still, it is essential to address the challenges to ensure businesses can take full advantage of these technologies. By understanding the benefits and challenges, companies can make informed decisions about implementing AI and ML in their analytics strategies.

Future predictions for AI and ML in the analytics industry
The future of AI and ML in the analytics industry is inspiring, with the potential to transform how businesses make decisions and gain insights from data. Here are some predictions for how AI and ML will continue to evolve in the analytics industry:
- Increased automation: As AI and ML algorithms become more advanced, businesses can automate more complex tasks, freeing time for employees to focus on higher-level tasks.
- Integration with other technologies: AI and ML will continue integrating with other technologies, such as the Internet of Things (IoT), to create a more interconnected and intelligent ecosystem.
- Greater emphasis on explainable AI: As AI and ML algorithms become more complex, there will be a greater emphasis on creating transparent and explainable models, enabling humans to understand how the algorithms arrived at their decisions.
- More advanced natural language processing: NLP will evolve, enabling computers to understand and respond to human language more naturally and intuitively.
- Continued growth in unsupervised learning: Unsupervised learning, which involves training algorithms on unlabeled data, will become increasingly important as businesses seek insights from unstructured data sources.
- Increased focus on ethical considerations: As AI and ML become more prevalent in the analytics industry, there will be a greater focus on ensuring these technologies are used ethically and responsibly.
The future of AI and ML in the analytics industry is promising, with the potential to transform how businesses operate and make decisions. We can expect to see even more innovative and exciting applications as these technologies evolve.
Data Visualization and Dashboarding
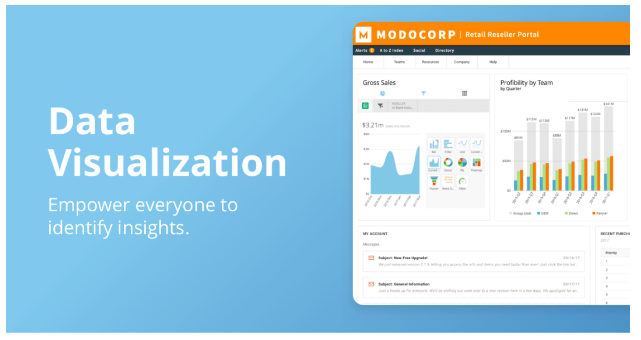
Data Visualization and Dashboarding are essential tools for businesses to gain insights from data and communicate information effectively. Data Visualization involves using graphical representations, such as charts, graphs, and maps, to convey information clearly and concisely. On the other hand, Dashboarding involves using a single interface to present key performance indicators (KPIs) and metrics in real time.
The benefits of Data Visualization and Dashboarding are numerous. Here are some key benefits:
- Improved understanding of data: Data Visualization allows users to see patterns, trends, and relationships in data more efficiently, enabling them to gain insights that might not be apparent in raw data.
- Effective communication: Data Visualization and Dashboarding allow businesses to communicate complex information clearly and concisely, enabling stakeholders to make more informed decisions.
- Real-time monitoring: Dashboarding provides real-time monitoring of KPIs and metrics, enabling businesses to respond quickly to changes in performance.
- Identification of outliers: Data Visualization can help businesses identify outliers and anomalies in data, enabling them to investigate potential issues and take corrective action.
- Increased engagement: Data Visualization and Dashboarding can make data more engaging and interactive, increasing user engagement and improving the overall user experience.
Data Visualization and Dashboarding are essential tools for businesses to gain insights from data and communicate information effectively. By leveraging these tools, companies can improve decision-making, monitor performance in real-time, and gain a competitive advantage in today’s data-driven world.
What are data visualization and dashboarding, and how are they used in the analytics industry?
Data Visualization and Dashboarding are two essential tools in the analytics industry that help businesses to gain insights from data and communicate information effectively.
Data Visualization involves using graphical representations, such as charts, graphs, maps, and other visual elements, to convey information clearly and easily. Data Visualization allows users to see patterns, trends, and relationships in data more efficiently, enabling them to gain insights that might not be apparent in raw data. Data visualization aims to provide a visual representation of data that can be understood at a glance.
Dashboarding is a specific type of data visualization that involves the presentation of key performance indicators (KPIs) and metrics in a single interface. A dashboard provides real-time monitoring of KPIs and metrics, enabling businesses to respond quickly to changes in performance. Dashboards can be customized to suit the needs of different users, allowing them to focus on the most relevant information.
In the analytics industry, Data Visualization and Dashboarding help businesses gain insights from their data, communicate information effectively, and make data-driven decisions. For example, companies might use Data Visualization and Dashboarding to monitor website traffic, track sales performance, analyze customer behavior, or identify trends in market data. By leveraging these tools, businesses can improve decision-making, monitor real-time performance, and gain a competitive advantage in today’s data-driven world.
Data Visualization and Dashboarding are critical tools in the analytics industry that help businesses to gain insights from data, communicate information effectively, and make data-driven decisions. By leveraging these tools, companies can unlock the full potential of their data and gain a competitive advantage in their respective industries.
How can I implement data visualization and dashboarding in my analytics strategy?
Implementing Data Visualization and Dashboarding in your analytics strategy can help you gain insights from your data and communicate information effectively. Here are some steps to help you implement Data Visualization and Dashboarding in your analytics strategy:
- Identify your data sources: The first step is to identify the data sources you want to visualize. This may include data from various systems, such as CRM, ERP, or social media.
- Determine your KPIs: Determine the key performance indicators (KPIs) you want to track and identify the metrics you will use to measure them.
- Choose your visualization tools: There are many Data Visualization and Dashboarding tools available, such as Tableau, Power BI, or Qlik. Choose a tool that fits your needs and budget.
- Design your dashboard: Once you have chosen your visualization tool, design your dashboard. Consider the needs of your audience and the information that is most important to them. Keep the design simple and uncluttered.
- Test and refine: Test your dashboard with a small group of users, and gather feedback. Use this feedback to refine your design and improve the user experience.
- Integrate into your analytics strategy: Once your dashboard is designed and refined, integrate it into your analytics strategy. Use the insights you gain to make data-driven decisions and improve your overall performance.
Implementing Data Visualization and Dashboarding in your analytics strategy can help you gain insights from your data and communicate information effectively. By following these steps, you can design a dashboard that meets the needs of your audience and helps you achieve your business goals.
What are some benefits and challenges of implementing data visualization and dashboarding in analytics?
Implementing Data Visualization and Dashboarding in analytics has the potential to provide numerous benefits, but it also presents some challenges. Here are some of the key benefits and challenges of implementing Data Visualization and Dashboarding in analytics:
Benefits:
- Improved understanding of data: Data Visualization allows users to see patterns, trends, and relationships in data more efficiently, enabling them to gain insights that might not be apparent in raw data.
- Effective communication: Data Visualization and Dashboarding allow businesses to communicate complex information clearly and concisely, enabling stakeholders to make more informed decisions.
- Real-time monitoring: Dashboarding provides real-time monitoring of KPIs and metrics, enabling businesses to respond quickly to changes in performance.
- Identification of outliers: Data Visualization can help businesses identify outliers and anomalies in data, enabling them to investigate potential issues and take corrective action.
- Increased engagement: Data Visualization and Dashboarding can make data more engaging and interactive, increasing user engagement and improving the overall user experience.
Challenges:
- Data quality: Data Visualization and Dashboarding rely on high-quality data to produce accurate results. Data quality can lead to accurate predictions or decisions.
- Lack of expertise: Designing effective Data Visualization and Dashboarding requires a certain level of knowledge, and businesses may need to invest in training or hiring professionals to do this.
- Data privacy and security: Data Visualization and Dashboarding can be vulnerable to security threats, and businesses must protect sensitive data.
- Over-reliance on visualization: Over-reliance on Data Visualization and Dashboarding can lead to a lack of critical thinking and a failure to consider other factors that may impact performance.
Implementing Data Visualization and Dashboarding in analytics can provide significant benefits. Still, it is essential to address the challenges to ensure businesses can take full advantage of these tools. By understanding the benefits and challenges, businesses can make informed decisions about implementing Data Visualization and Dashboarding in their analytics strategies.
Predictive Analytics
Predictive Analytics is a branch of advanced analytics that uses data mining, machine learning, and statistical modeling techniques to analyze historical data and predict future events or trends. Predictive Analytics involves analyzing data sets to identify patterns and relationships, which can be used to predict future outcomes or behaviors.
Predictive Analytics aims to provide businesses with actionable insights that can help them make better decisions and improve their overall performance. Predictive Analytics can be used in many industries, such as finance, healthcare, marketing, and transportation, to predict customer behavior, sales trends, operational efficiency, and more.
There are several steps involved in the Predictive Analytics process. These include:
- Data collection: The first step is to collect the data used in the analysis. This may include structured and unstructured data from various sources, such as customers, transactions, social media, etc.
- Data preprocessing: The data must be cleaned and prepared for analysis, which involves removing errors, filling in missing data, and converting data into a usable format.
- Model building: A statistical model uses machine learning algorithms and other techniques. The model is trained on historical data to predict future events or trends.
- Model validation: The model is validated to ensure accuracy and reliability. This may involve testing the model on new data sets or using other techniques to validate its performance.
- Deployment: The final step is to deploy the model in a production environment, where it can be used to make predictions and inform decision-making.
Predictive Analytics is a powerful tool that can help businesses make more informed decisions and improve their overall performance. By using data to make predictions, businesses can gain a competitive advantage and stay ahead of the curve in today’s data-driven world.
What is predictive analytics?
Predictive analytics analyzes historical data to predict future events or trends using statistical modeling, data mining, and machine learning techniques. Predictive analytics uses data patterns and relationships to predict what will happen in the future. This type of analytics can help businesses make data-driven decisions and gain insights that would be impossible to obtain through other means.
Predictive analytics aims to identify patterns and trends in data that can be used to make accurate predictions about future events. For example, a retailer may use predictive analytics to analyze customer purchase history and predict future buying behavior. Or a healthcare provider may use predictive analytics to analyze patient data and make predictions about disease outbreaks or treatment outcomes.
The predictive analytics process involves several steps, including data collection, preprocessing, model building, validation, and deployment. Predictive analytics is essential for businesses to stay ahead of the competition, make informed decisions, and optimize their operations. By using predictive analytics, companies can gain insights into customer behavior, market trends, and other factors that impact their performance, enabling them to make data-driven decisions that drive growth and success.
What is predictive analytics, and how is it used in the analytics industry?
Predictive Analytics is a technique used in the analytics industry that uses statistical algorithms and machine learning techniques to analyze historical data and predict future events or trends. Predictive Analytics is used to identify patterns in data that can help businesses make more informed decisions, optimize operations, and gain a competitive advantage.
In the analytics industry, Predictive Analytics is used in many different ways. Here are some examples:
- Customer Behavior Prediction: Predictive Analytics is used to predict customer behavior, such as which products or services they are likely to purchase or when they are likely to make a purchase. This helps businesses to personalize marketing efforts, improve customer engagement, and increase sales.
- Fraud Detection: Predictive Analytics detect fraudulent activity, such as credit card or insurance fraud. By analyzing historical data and identifying patterns, Predictive Analytics can help businesses identify potential fraud and take corrective action.
- Risk Management: Predictive Analytics identifies potential risks and forecasts potential losses. This allows businesses to make informed decisions about risk management strategies and proactively mitigate risk.
- Inventory Management: Predictive Analytics forecasts demand and optimizes inventory levels. This helps businesses to reduce waste and increase profitability.
- Quality Control: Predictive Analytics detect quality issues before they become major problems. By analyzing data from sensors and other sources, Predictive Analytics can identify patterns that indicate a potential issue and trigger corrective action.
Predictive Analytics is an essential tool in the analytics industry that helps businesses to gain insights from data and make more informed decisions. By using Predictive Analytics, companies can improve performance, reduce costs, and gain a competitive advantage in today’s data-driven world.
How can I implement predictive analytics in my analytics strategy?
Implementing Predictive Analytics in your analytics strategy can help you gain insights from data and make more informed decisions. Here are some steps to help you implement Predictive Analytics in your analytics strategy:
- Identify your business problem: The first step is to identify a business problem that can be solved using Predictive Analytics. This could be related to customer behavior, fraud detection, inventory management, risk management, or quality control.
- Define your data requirements: Determine the data requirements for your predictive model. This may include historical, demographic, transactional, and other relevant data sources.
- Choose your modeling technique: Select the modeling technique that is best suited for your business problem. Many different techniques are available, such as linear regression, decision trees, and neural networks.
- Build your predictive model: Develop your predictive model using the selected technique. This involves training the model on historical data and testing it to ensure accuracy and reliability.
- Evaluate your model: Evaluate your model’s performance by testing it on new data sets or using other validation techniques. This will help you to refine your model and improve its accuracy.
- Deploy your model: Once it is validated, deploy it in a production environment where it can be used to make predictions and inform decision-making.
- Monitor and update your model: Monitor your model’s performance over time and update it as needed to ensure that it continues to provide accurate predictions.
Implementing Predictive Analytics in your analytics strategy can help you gain insights from data and make more informed decisions. By following these steps, you can develop a predictive model that meets the needs of your business and helps you achieve your goals.

Benefits and challenges of implementing predictive analytics in analytics
Implementing Predictive Analytics in analytics have the potential to provide numerous benefits, but it also presents some challenges. Here are some key benefits and challenges of implementing Predictive Analytics in analytics:
Benefits:
- Improved decision-making: Predictive Analytics helps businesses make more informed decisions by providing insights into future events and trends.
- Increased efficiency: Predictive Analytics can help businesses optimize operations and reduce costs by identifying potential issues before they become significant problems.
- Competitive advantage: Predictive Analytics can help businesses gain a competitive advantage by providing insights their competitors may not have.
- Personalized customer experiences: Predictive Analytics can help businesses personalize customer experiences by predicting customer behavior and preferences.
- Improved risk management: Predictive Analytics can help businesses identify and mitigate potential risks, reducing the likelihood of losses.
Challenges:
- Data quality: Predictive Analytics relies on high-quality data to produce accurate results. Data quality can lead to accurate predictions or decisions.
- Lack of expertise: Implementing Predictive Analytics requires certain expertise, and businesses may need to invest in training or hiring professionals.
- Data privacy and security: Predictive Analytics can be vulnerable to security threats, and businesses must protect sensitive data.
- Over-reliance on Predictive Analytics: Over-reliance on Predictive Analytics can lead to a lack of critical thinking and a failure to consider other factors that may impact performance.
Implementing Predictive Analytics in analytics has the potential to provide significant benefits. Still, it is essential to address the challenges to ensure businesses can take full advantage of these tools. By understanding the benefits and challenges, businesses can make informed decisions about implementing Predictive Analytics in their analytics strategies.
Future predictions for predictive analytics in the analytics industry
The future of Predictive Analytics in the analytics industry is bright, with many new developments and advancements on the horizon. Here are some future predictions for Predictive Analytics in the analytics industry:
- Increased use of AI and Machine Learning: AI and Machine Learning techniques will become more prevalent in Predictive Analytics, enabling businesses to make even more accurate predictions and gain deeper insights from data.
- Integration with IoT: Predictive Analytics with the Internet of Things (IoT) will enable businesses to collect real-time data from sensors and other sources, providing even more accurate predictions and insights.
- More personalized experiences: Predictive Analytics will become even more advanced in predicting customer behavior and preferences, enabling businesses to offer more personalized experiences and build stronger customer relationships.
- Increased focus on data ethics and privacy: With the increasing importance of data ethics and privacy, businesses must prioritize data protection and transparency when implementing Predictive Analytics.
- Greater adoption in smaller businesses: As Predictive Analytics becomes more accessible and user-friendly, smaller businesses will also adopt it to gain insights from their data and make more informed decisions.
Predictive Analytics will continue to play a crucial role in the analytics industry, providing businesses with the insights they need to make data-driven decisions and gain a competitive advantage. As technology advances, we expect more exciting developments and advancements in Predictive Analytics.
Augmented Analytics
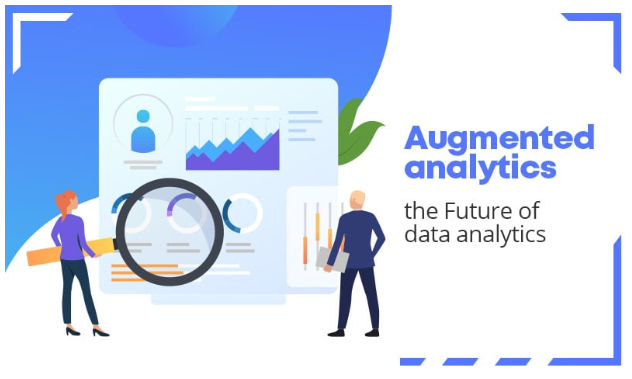
Augmented Analytics is an emerging trend in the analytics industry that uses machine learning algorithms and natural language processing to automate and enhance the data analysis process. Augmented Analytics uses machine learning and other techniques to identify patterns and relationships in data and provide automated insights and recommendations to users.
Augmented Analytics aims to make data analysis more accessible to a broader range of users, including business analysts and non-technical users. By automating many of the tasks involved in data analysis, Augmented Analytics can help users focus on the insights and recommendations most relevant to their business goals.
Augmented Analytics incorporates several technologies, including natural language processing, machine learning, and cognitive computing. These technologies enable users to interact with data more naturally, using language and context to ask questions and receive answers.
Some key benefits of Augmented Analytics include:
- Improved data insights: It provides automated insights and recommendations to help businesses gain deeper insights into their data.
- Increased efficiency: By automating many of the tasks involved in data analysis, Augmented Analytics can help businesses to save time and increase efficiency.
- Improved accuracy: Augmented Analytics uses machine learning algorithms to identify patterns and relationships in data, providing more accurate insights and recommendations.
- Increased accessibility: Augmented Analytics makes data analysis more accessible to a broader range of users, including those without technical expertise.
- Faster decision-making: Augmented Analytics can help businesses make more rapid and informed decisions by providing real-time insights and recommendations.
Augmented Analytics is an important trend in the analytics industry, potentially providing significant benefits to businesses of all sizes. By automating many of the tasks involved in data analysis and giving automated insights and recommendations, Augmented Analytics can help businesses to gain a competitive advantage and achieve their business goals.
What is augmented analytics, and how is it used in the industry?
Augmented Analytics is a new approach to data analysis that combines machine learning, natural language processing, and other advanced technologies to automate and enhance the data analysis process.
Augmented Analytics uses algorithms to identify patterns and relationships in data and provide automated insights and recommendations to users. It is used in the analytics industry to make data analysis more accessible, efficient, and accurate.
Augmented Analytics is designed to be more user-friendly and accessible, even for non-technical users. It uses natural language processing to allow users to ask questions about their data in plain language without complex queries or programming. Augmented Analytics also uses machine learning algorithms to identify patterns and relationships in data, providing automated insights and recommendations that can help businesses gain deeper insights into their data.
In the analytics industry, Augmented Analytics improves data analysis in several ways, such as
- Improved data insights: Augmented Analytics provides automated insights and recommendations that help businesses gain deeper insights into their data.
- Increased efficiency: By automating many of the tasks involved in data analysis, Augmented Analytics can help businesses to save time and increase efficiency.
- Improved accuracy: Augmented Analytics uses machine learning algorithms to identify patterns and relationships in data, providing more accurate insights and recommendations.
- Increased accessibility: Augmented Analytics makes data analysis more accessible to a broader range of users, including those without technical expertise.
- Faster decision-making: Augmented Analytics can help businesses make more rapid and informed decisions by providing real-time insights and recommendations.
Augmented Analytics is an important development in the analytics industry, potentially providing significant benefits to businesses of all sizes. By automating many of the tasks involved in data analysis and giving automated insights and recommendations, Augmented Analytics can help companies to gain a competitive advantage and achieve their business goals.
How can I implement augmented analytics in my analytics strategy?
Implementing Augmented Analytics in your analytics strategy can help you gain deeper insights into your data and make more informed decisions. Here are some steps to help you implement Augmented Analytics in your analytics strategy:
- Identify your business problem: The first step is to identify a business problem that can be solved using Augmented Analytics. This could be related to customer behavior, fraud detection, inventory management, risk management, or quality control.
- Define your data requirements: Determine the data requirements for your Augmented Analytics model. This may include historical, demographic, transactional, and other relevant data sources.
- Choose your Augmented Analytics platform: Select an Augmented Analytics platform that is best suited for your business problem. Many different platforms are available, such as Tableau, QlikView, and Microsoft Power BI.
- Build your Augmented Analytics model: Develop your Augmented Analytics model using the selected platform. This involves training the model on historical data and testing it to ensure accuracy and reliability.
- Evaluate your model: Evaluate the performance of your Augmented Analytics model by testing it on new data sets or using other validation techniques. This will help you to refine your model and improve its accuracy.
- Deploy your model: Once it is validated, deploy it in a production environment where it can provide automated insights and recommendations to users.
- Monitor and update your model: Monitor the performance of your Augmented Analytics model over time and update it as needed to ensure that it continues to provide accurate insights and recommendations.
Implementing Augmented Analytics in your analytics strategy can help you gain deeper insights into your data and make more informed decisions. By following these steps, you can develop an Augmented Analytics model that meets the needs of your business and helps you achieve your goals.

What are some benefits and challenges of implementing augmented analytics in analytics?
Implementing Augmented Analytics in analytics has the potential to provide numerous benefits, but it also presents some challenges. Here are some of the key benefits and challenges of implementing Augmented Analytics in analytics:
Benefits:
- Improved data insights: Augmented Analytics provides automated insights and recommendations to help businesses gain deeper insights into their data.
- Increased efficiency: By automating many of the tasks involved in data analysis, Augmented Analytics can help businesses to save time and increase efficiency.
- Improved accuracy: Augmented Analytics uses machine learning algorithms to identify patterns and relationships in data, providing more accurate insights and recommendations.
- Increased accessibility: Augmented Analytics makes data analysis more accessible to a wider range of users, including those without technical expertise.
- Faster decision-making: Augmented Analytics can help businesses make faster and more informed decisions by providing real-time insights and recommendations.
Challenges:
- Data quality: Augmented Analytics relies on high-quality data to produce accurate results. Poor data quality can lead to inaccurate insights or recommendations.
- Lack of expertise: Implementing Augmented Analytics requires a certain level of knowledge, and businesses may need to invest in training or hiring professionals.
- Data privacy and security: Augmented Analytics can be vulnerable to security threats, and businesses must protect sensitive data.
- Over-reliance on Augmented Analytics: Over-reliance on Augmented Analytics can lead to a lack of critical thinking and a failure to consider other factors that may impact performance.
Implementing Augmented Analytics in analytics has the potential to provide significant benefits. Still, it is important to address the challenges to ensure businesses can take full advantage of these tools. By understanding the benefits and challenges, businesses can make informed decisions about implementing Augmented Analytics in their analytics strategies.
Future predictions for augmented analytics in the analytics industry
The future of Augmented Analytics in the analytics industry is promising, with many new developments and advancements on the horizon. Here are some future predictions for Augmented Analytics in the analytics industry:
- Increased use of AI and Machine Learning: AI and Machine Learning techniques will become even more prevalent in Augmented Analytics, enabling businesses to make more accurate predictions and gain deeper insights from data.
- Greater automation: Augmented Analytics will become even more automated, with fewer manual steps to generate insights and recommendations.
- Increased focus on natural language processing: Natural language processing will become even more critical in Augmented Analytics, enabling users to interact with data more naturally and ask questions in plain language.
- Greater integration with other technologies: Augmented Analytics will become more integrated with other technologies, such as IoT and blockchain, enabling businesses to gain even deeper insights from their data.
- Greater adoption in smaller businesses: As Augmented Analytics becomes more accessible and user-friendly, smaller companies will also adopt it to gain insights from their data and make more informed decisions.
Augmented Analytics will continue to play a crucial role in the analytics industry, providing businesses with the insights they need to make data-driven decisions and gain a competitive advantage. As technology advances, we expect to see more exciting developments and advancements in Augmented Analytics.
Conclusion
Final thoughts on the latest trends and developments in the analytics industry
The analytics industry is constantly evolving, with new trends and developments always emerging. AI, ML, Data Visualization, Predictive Analytics, and Augmented Analytics are just a few of the latest trends transforming how to use data to gain insights and make informed decisions.
These technologies offer significant benefits, such as improved accuracy, increased efficiency, and personalized experiences. However, they also present challenges like data quality, lack of expertise, and data privacy and security.
As businesses continue to adopt these technologies, addressing these challenges and ensuring they are used responsibly and ethically is essential. By doing so, businesses can take full advantage of the latest trends and developments in the analytics industry to gain a competitive advantage and achieve their business goals.
In conclusion, the analytics industry is constantly evolving and dynamic. By staying up-to-date with the latest trends and developments, businesses can gain valuable insights from their data and make more informed decisions. As technology advances, we expect more exciting developments and advancements in the analytics industry. Businesses need to stay ahead of the curve to remain competitive.

