Are metrics and analytics the same thing?
Many people use these terms interchangeably, but they actually have distinct differences.
Metrics measure specific data points such as traffic, clicks, and social media followers. Analytics, on the other hand, analyze and interpret data to gain insights and make informed decisions.
By understanding these differences, you can leverage both metrics and analytics to make data-driven decisions for your business. In this article, we’ll dive deeper into the distinctions between metrics and analytics and explore their unique benefits.
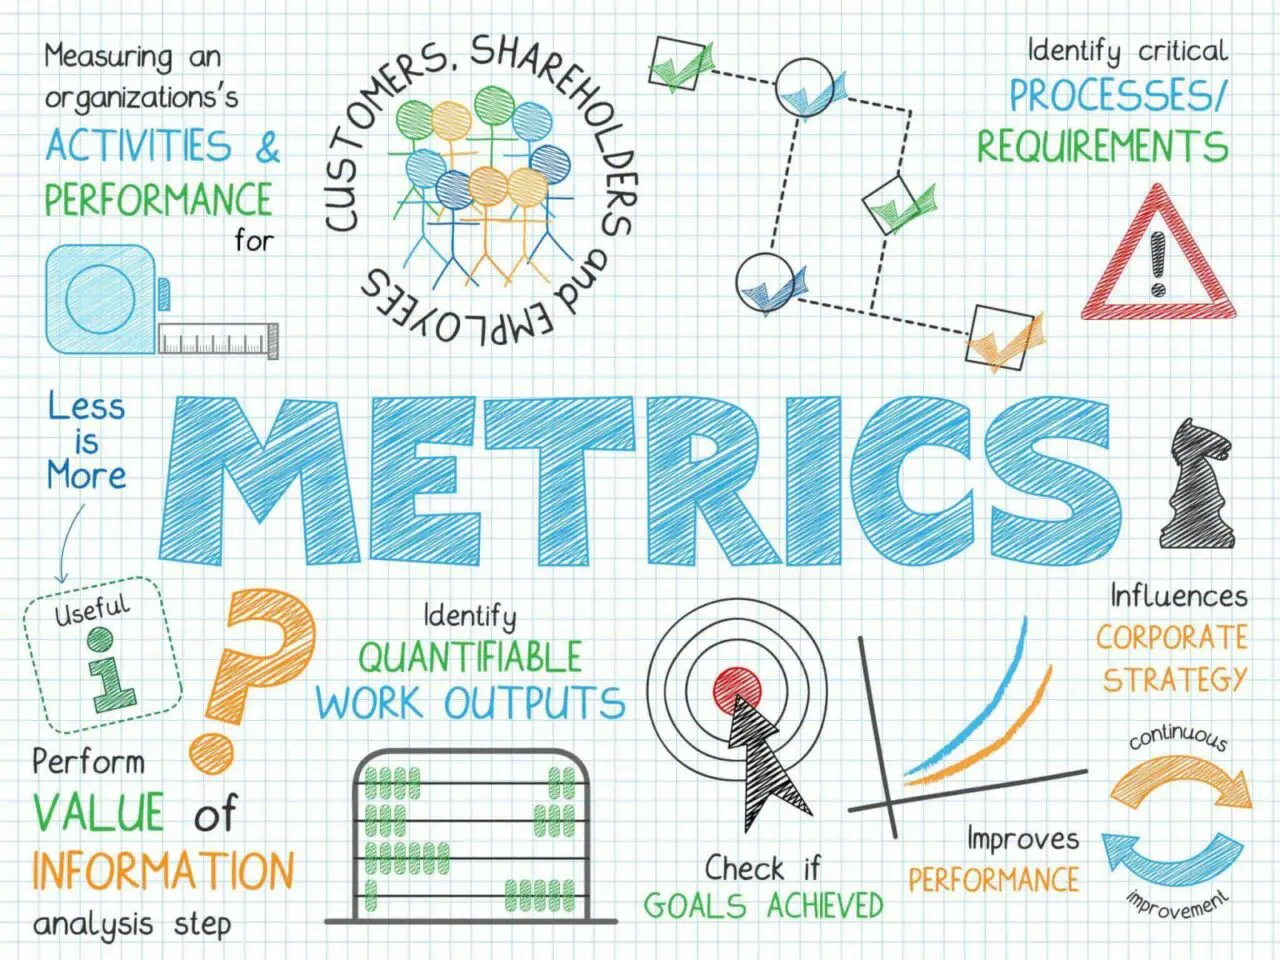
What are Metrics
Metrics are quantifiable measures used to evaluate and track performance or progress. In business and marketing, metrics are essential for monitoring the success of various initiatives and campaigns. Standard metrics used in this context include conversion rates, click-through rates, engagement rates, and return on investment (ROI).
By defining and tracking relevant metrics, companies can ensure that they are progressing toward their objectives and maximizing the impact of their efforts. By monitoring these metrics, businesses can gain insight into their marketing strategies’ effectiveness, identify improvement areas, and make data-driven decisions.
It’s important to note that the metrics that matter most will vary depending on the business and the specific goals of each campaign.
Types of metrics
There are various types of metrics that businesses can use to evaluate, track and analyze different aspects of their operations. Some of the most common types of metrics include:
- Financial Metrics: These metrics track the financial performance of a business, such as revenue, profit margins, and cash flow.
- Customer Metrics: These metrics focus on customer behavior and satisfaction, such as customer acquisition costs, retention rates, and Net Promoter Score (NPS).
- Operational Metrics: These metrics evaluate the efficiency and productivity of a business, such as a cycle time, throughput, and quality metrics.
- Marketing Metrics: These metrics evaluate the effectiveness of a company’s marketing efforts, such as conversion rates, click-through rates, and social media engagement metrics.
- Employee Metrics: These metrics evaluate the performance and engagement of employees, such as employee satisfaction, turnover rates, and productivity metrics.
- Sales Metrics: These metrics evaluate the sales performance of a business, such as sales revenue, sales growth, and sales cycle length.
By combining these metrics, businesses can gain a comprehensive understanding of their operations, identify areas for improvement, and make data-driven decisions to optimize performance and achieve their goals.
Metrics in business and marketing
Metrics are essential in business and marketing to evaluate, track and analyze performance, progress, and success. In business, metrics monitor financial performance, customer satisfaction, employee engagement, and operational efficiency.
By following these metrics, businesses can identify areas of strength and weakness, make data-driven decisions, and optimize overall performance. In marketing, metrics evaluate the effectiveness of marketing campaigns, social media efforts, and other promotional activities.
Standard marketing metrics include conversion, click-through, engagement, and ROI. By tracking these metrics, marketers can identify which initiatives generate the most leads, sales, and employment and adjust their strategies accordingly to maximize impact.
It’s important to note that the metrics that matter most will vary depending on the business or marketing goals. By defining and tracking relevant metrics, businesses, and marketers can ensure they progress toward their objectives and achieve the desired outcomes.
Metrics are critical for evaluating performance, identifying opportunities for improvement, and making data-driven decisions in both business and marketing.
How can metrics be used to track progress and identify areas for improvement?
Metrics can be used to track progress and identify areas for improvement in various ways. By monitoring and analyzing relevant metrics, businesses can gain insights into key performance indicators (KPIs) that help them understand their current performance and make data-driven decisions to optimize future performance.
For example, if a business wants to increase website traffic, it might track metrics such as page views, unique visitors, and bounce rates. By analyzing these metrics, they can identify which pages drive the most traffic, where visitors are coming from, and which pages are causing visitors to leave. This information can help them identify areas for improvement, such as optimizing page load times, improving the user experience, or creating more engaging content.
Similarly, in marketing, metrics such as conversion rates, click-through rates, and engagement rates can be used to track progress and identify areas for improvement. By analyzing these metrics, marketers can determine which initiatives generate the most leads or sales, which channels are most effective for reaching their target audience, and which messaging resonates most. This information can help them adjust their strategies and tactics to optimize performance and achieve their marketing goals.
Metrics can be used to track progress and identify areas for improvement by providing insights into key performance indicators and helping businesses and marketers make data-driven decisions to optimize their operations and achieve their goals.
What is analytics
Analytics collects, analyzes, and interprets data to gain insights and make informed decisions. In business, analytics is used to evaluate and improve various aspects of operations, such as financial performance, customer behavior, and marketing effectiveness.
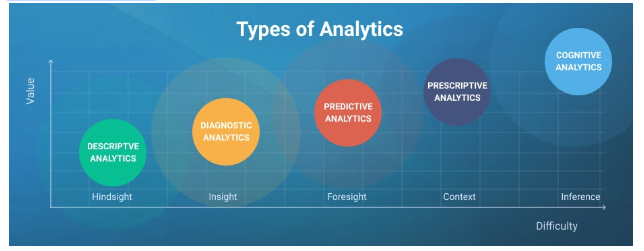
Analytics involves data and statistical methods to uncover patterns, trends, and relationships that inform decision-making. Analytics can take many forms, including descriptive analytics, which consists in summarizing data to provide an overview of performance, and predictive analytics, which involves using data and statistical models to predict future outcomes.
Other types of analytics include diagnostic analytics, which involves using data to understand why specific outcomes occurred, and prescriptive analytics, which involves using data and models to determine the best course of action to achieve a desired result.
Analytics can be applied in various fields, including finance, healthcare, sports, and marketing. In marketing, analytics is used to evaluate the effectiveness of campaigns and initiatives, measure customer engagement, and optimize marketing strategies. By leveraging analytics, businesses can gain a deeper understanding of their operations, identify areas for improvement, and make data-driven decisions to maximize performance and achieve their goals.
Types of analytics
Businesses can use several types of analytics to gain insights from their data. Some of the most common types of analytics include:
- Descriptive Analytics: This type involves summarizing and analyzing historical data to understand past performance. Descriptive analytics includes metrics such as revenue, profit, and customer demographics.
- Diagnostic Analytics: This type of analytics analyzes data to determine why a particular event or outcome occurred. Diagnostic analytics includes methods such as root cause analysis and correlation analysis.
- Predictive Analytics: This type involves using statistical models and machine learning algorithms to predict future outcomes based on historical data. Predictive analytics includes methods such as regression analysis and time series analysis.
- Prescriptive Analytics: This type uses data and models to determine the best action to achieve a desired outcome. Prescriptive analytics includes methods such as optimization and simulation.
- Text Analytics: This type of analytics involves analyzing unstructured data such as text from social media, customer reviews, and support tickets to gain insights about customer sentiment, preferences, and behavior.
- Web Analytics: This type of analytics involves analyzing website data to gain insights about user behavior, such as clickstream analysis and conversion tracking.
By combining these analytics techniques, businesses can gain a comprehensive understanding of their operations, identify areas for improvement, and make data-driven decisions to optimize performance and achieve their goals.
Analytics in business and marketing
Analytics plays a critical role in both business and marketing. It provides insights into key performance indicators (KPIs) that help managers and marketers make informed decisions to optimize operations and achieve their goals.
In business, analytics evaluates financial performance, customer behavior, supply chain operations, and other areas. By leveraging data and analytics tools, companies can gain a deeper understanding of their operations, identify areas for improvement, and make data-driven decisions to optimize performance.
In marketing, analytics is used to evaluate the effectiveness of campaigns, measure customer engagement, and optimize marketing strategies. By tracking metrics such as conversion, click-through, and engagement rates, marketers can identify which initiatives generate the most leads or sales, which channels are most effective for reaching their target audience, and which messaging resonates the most with them. This information can help them adjust their strategies and tactics to optimize performance and achieve their marketing goals.
In both business and marketing, analytics can take many forms, including descriptive, predictive, and prescriptive analytics. By combining these techniques, businesses and marketers can comprehensively understand their operations, identify areas for improvement, and make data-driven decisions to optimize performance and achieve their goals.
How can analytics be used to make data-driven decisions?
Analytics can make data-driven decisions by providing valuable insights and information that enable managers and decision-makers to evaluate options and select the best action based on data and evidence.
- Firstly, analytics can help to identify trends and patterns in data that may not be immediately apparent, revealing insights that can inform decision-making. By analyzing data and identifying trends, managers can gain a deeper understanding of their operations and identify areas for improvement.
- Secondly, analytics can help to forecast future outcomes based on historical data and trends. Predictive analytics, for example, can be used to identify potential future developments, allowing managers to make informed decisions about the future direction of their organization.
- Thirdly, analytics can evaluate the impact of different courses of action. By simulating different scenarios and analyzing the results, decision-makers can select the course of action most likely to lead to the desired outcome.
- Finally, analytics can help decision-makers to evaluate risks and trade-offs associated with different options. By analyzing data and identifying potential risks and outcomes, decision-makers can make informed decisions about the best action.
Analytics can make data-driven decisions by providing insights into trends and patterns, forecasting future outcomes, evaluating the impact of different courses of action, and evaluating risks and trade-offs associated with other options. By leveraging analytics to make data-driven decisions, managers can optimize performance, achieve their goals, and stay ahead of the competition.
Differences between Metrics and Analytics
Metrics and analytics are related concepts but have distinct differences in meanings and applications.
Metrics are quantifiable measures used to evaluate and track performance or progress. Metrics can be used to assess performance, measure progress toward goals, and identify areas for improvement. Metrics are often numerical values, such as conversion rates, click-through rates, and customer satisfaction scores.
On the other hand, analytics is the process of collecting, analyzing, and interpreting data to gain insights and make informed decisions. Analytics involves data and statistical methods to uncover patterns, trends, and relationships that inform decision-making. Analytics often involves various metrics, but it is a broader process that includes data collection, analysis, and interpretation.
Metrics are the individual values used to evaluate performance or progress, while analytics is the process of using data to gain insights and make informed decisions. Metrics provide a specific snapshot of performance at a given time, while analytics provides a deeper understanding of the underlying factors and trends that impact performance.
The focus of metrics vs. analytics
Metrics are often numerical values used to evaluate performance and identify areas for improvement. Metrics are often numerical values used to assess performance and identify areas for improvement. The metrics focus on quantifying performance and progress, often using a set of predefined measures.
The focus of analytics, on the other hand, is on gaining insights and making informed decisions based on data. Analytics involves collecting, analyzing, and interpreting data to identify patterns, trends, and relationships that inform decision-making. Analytics focuses on understanding the underlying factors and drivers of performance, predicting future outcomes, and identifying opportunities for improvement.
While metrics and analytics are related concepts, metrics focus on measurement and tracking, while analytics focus on gaining insights and making informed decisions based on data. Both metrics and analytics are essential for evaluating performance, identifying areas for improvement, and making data-driven decisions, but they approach the task from different perspectives.
The granularity of metrics vs. analytics
The granularity of metrics refers to the level of detail or specificity of the data being measured. Metrics can be calculated at various levels of granularity, ranging from broad, high-level measures to specific, granular actions.
The granularity of metrics refers to the level of detail or specificity of the data being measured. For example, a high-level financial metric, such as revenue, might be calculated monthly or quarterly. In contrast, a more granular metric, such as customer churn, might be measured daily or weekly.
The granularity of analytics refers to the level of detail or specificity of the data being analyzed. Analytics can be conducted at various levels, ranging from broad, high-level analyses to specific, granular studies. The granularity of analytics refers to the level of detail or specificity of the data being analyzed.
For example, a high-level customer behavior analysis might involve analyzing aggregate data over a long period. A more granular analysis might involve analyzing individual customer transactions in real-time.
Both metrics and analytics can be conducted at various levels of granularity, depending on the analysis’s specific goals and the data availability. In general, metrics tend to focus more on specific, measurable values, while analytics focuses on identifying trends and patterns in data.
Both metrics and analytics can be conducted at various levels of granularity, depending on the analysis’s specific goals and the data availability. By using metrics and analytics at different levels of granularity, businesses can gain a comprehensive understanding of their operations and make informed decisions based on data.

Relationship between metrics and analytics
Metrics and analytics are closely related concepts that comprehensively understand performance and progress. Metrics provide specific, measurable values used to evaluate performance, measure progress toward goals, and identify areas for improvement. Conversely, analytics involves using data and statistical methods to uncover patterns, trends, and relationships in the metrics, allowing decision-makers to gain deeper insights and make informed decisions.
Metrics provide the raw data used in analytics, while analytics provides the tools and methods for analyzing that data to gain insights and make informed decisions. For example, a business might track metrics such as revenue, customer satisfaction scores, and employee productivity and then use analytics to identify patterns and relationships in the data, such as the relationship between customer satisfaction and revenue.
By using metrics and analytics together, businesses can gain a comprehensive understanding of their operations, identify areas for improvement, and make data-driven decisions to optimize performance and achieve their goals. The relationship between metrics and analytics is one of the complementary functions, with metrics providing the data and analytics providing the methods and tools for analyzing that data.
Benefits of Metrics and Analytics
There are numerous benefits to using metrics and analytics in business, including the following:
- Improved decision-making: Metrics and analytics provide decision-makers with valuable insights and information to inform decisions and help them make informed choices.
- Optimized performance: By tracking metrics and using analytics to identify patterns and relationships in the data, businesses can identify areas for improvement and make data-driven decisions to optimize performance.
- Greater efficiency: Metrics and analytics can help businesses identify inefficiencies and bottlenecks in their operations, allowing them to make changes to increase efficiency and productivity.
- Improved customer satisfaction: By tracking customer metrics and using analytics to gain insights into customer behavior and preferences, businesses can make data-driven decisions to improve customer satisfaction and loyalty.
- Competitive advantage: By using metrics and analytics to gain insights into their operations and customers, businesses can earn a competitive advantage by making informed decisions and staying ahead of the competition.
- Cost savings: Metrics and analytics can help businesses identify areas where costs can be reduced, such as by optimizing supply chain operations or reducing customer churn.
The benefits of using metrics and analytics in business include improved decision-making, optimized performance, greater efficiency, improved customer satisfaction, competitive advantage, and cost savings. By leveraging metrics and analytics, companies can gain a comprehensive understanding of their operations, identify areas for improvement, and make data-driven decisions to achieve their goals.
Improved decision-making
Metrics and analytics can improve decision-making in several ways. Providing valuable insights and information about operations, customers, and other aspects of the business, metrics, and analytics can help decision-makers make more informed choices.
One way metrics and analytics improve decision-making is by providing objective, data-driven information. Rather than relying on intuition or anecdotal evidence, decision-makers can use metrics and analytics to make decisions based on complex data and evidence.
Another way metrics and analytics improve decision-making is by identifying trends and patterns that might take time to become apparent. By analyzing data and identifying patterns, decision-makers can gain a deeper understanding of their operations and identify areas for improvement.
Metrics and analytics can also improve decision-making by providing insights into customer behavior and preferences. By tracking customer metrics and using analytics to gain insights into customer behavior, decision-makers can make data-driven decisions about improving customer satisfaction, retention, and loyalty.
Metrics and analytics can improve decision-making by providing a framework for evaluating options and making informed choices. Using metrics and analytics to assess different courses of action and predict the potential outcomes, decision-makers can select the most likely to achieve the desired results.
Metrics and analytics can improve decision-making by providing objective, data-driven information, identifying trends and patterns, providing insights into customer behavior and preferences, and providing a framework for evaluating options and making informed choices.
Enhanced tracking and reporting
Metrics and analytics can also enhance tracking and reporting in business by providing more accurate and timely data that can be used to track performance, measure progress toward goals, and identify areas for improvement.
Using metrics to track performance, businesses can monitor key performance indicators (KPIs) and identify areas where performance falls short of expectations. This information can be used to make data-driven decisions to optimize performance and improve results.
Analytics can also enhance tracking and reporting by providing insights into the underlying factors and trends that impact performance. By analyzing data and identifying patterns, decision-makers can gain a deeper understanding of their operations and identify areas for improvement.
In addition, metrics and analytics can provide more accurate and timely data than traditional reporting methods. With real-time data tracking and analytics, businesses can quickly identify issues or trends and respond proactively to optimize performance.
Metrics and analytics can enhance tracking and reporting by providing customized reports and dashboards that provide a clear and concise view of performance. By providing stakeholders with easy-to-understand definitions and visualizations, businesses can communicate performance effectively and make data-driven decisions to achieve their goals.
Metrics and analytics can enhance tracking and reporting in business by providing more accurate and timely data, identifying underlying factors and trends, providing real-time monitoring and analytics, and providing customized reports and dashboards.
A better understanding of customer behavior and preferences
Metrics and analytics can provide businesses with a better understanding of customer behavior and preferences by analyzing data related to customer interactions, purchasing patterns, and other key metrics. By leveraging this data, businesses can gain valuable insights into customer needs, preferences, and pain points, allowing them to make data-driven decisions to improve customer satisfaction and loyalty.
One way metrics and analytics can improve understanding of customer behavior is by analyzing data related to customer interactions. For example, if a high volume of calls is related to a specific product issue, businesses can prioritize addressing that issue to improve customer satisfaction. Businesses can gain insights into customer needs and pain points by tracking metrics such as call volume, response times, and resolution rates.
Another way metrics and analytics can improve understanding of customer behavior is by analyzing data related to purchasing patterns. By tracking purchase frequency, average order value, and customer lifetime value, businesses can gain insights into customer preferences and identify opportunities for cross-selling and upselling.
Metrics and analytics can provide businesses with a better understanding of customer behavior by analyzing data related to customer sentiment and feedback. By tracking metrics such as Net Promoter Score (NPS) and customer satisfaction scores, businesses can gain insights into customer sentiment and identify areas for improvement.
Metrics and analytics can provide businesses with a better understanding of customer behavior and preferences by analyzing data related to customer interactions, purchasing patterns, and customer feedback. By leveraging this data, businesses can make data-driven decisions to improve customer satisfaction, loyalty, and overall business performance.
Competitive advantage
Metrics and analytics can help businesses gain a competitive advantage by providing insights and information to make more informed decisions and optimize performance.
One way metrics and analytics can provide a competitive advantage is by identifying opportunities for innovation and improvement. By analyzing data related to customer behavior, industry trends, and other vital metrics, businesses can identify areas for improvement and develop new products or services that better meet customer needs.
Another way metrics and analytics can provide a competitive advantage is by identifying operational inefficiencies and areas where costs can be reduced. By analyzing data related to supply chain operations, manufacturing processes, and other key metrics, businesses can identify areas where costs can be reduced, and efficiency can be increased, providing a competitive edge in terms of pricing and speed of delivery.
Metrics and analytics can also provide a competitive advantage by identifying customer preferences and behaviors that inform marketing and sales strategies. Businesses can develop targeted marketing campaigns that resonate with their target audience and drive more sales by analyzing customer demographics, purchase history, and other key metrics.
Metrics and analytics can provide a competitive advantage by providing real-time tracking and analytics that enable businesses to respond quickly to changes in the market. By tracking key metrics and reacting proactively to trends and changes in customer behavior, companies can stay ahead of the competition and capitalize on new opportunities.
Metrics and analytics can provide a competitive advantage by identifying opportunities for innovation and improvement, identifying operational inefficiencies and cost savings, informing marketing and sales strategies, and providing real-time tracking and analytics. By leveraging metrics and analytics effectively, businesses can gain a competitive edge and achieve their goals.

How to Use Metrics and Analytics Together?
Using metrics and analytics together can help businesses gain a comprehensive understanding of their operations, identify areas for improvement, and make data-driven decisions to achieve their goals. Here are some steps for using metrics and analytics together effectively:
- Identify key metrics: Start by identifying the key metrics that are most relevant to your business and goals. These include metrics related to sales, customer satisfaction, website traffic, or other areas of your business.
- Collect and analyze data: Once you have identified your key metrics, collect and analyze data related to those metrics. This might involve collecting data from multiple sources, such as customer surveys, website analytics, or sales reports.
- Use analytics to gain insights: Once you have collected data, use analytics tools to gain insights and identify patterns and trends in the data. This might involve data visualization tools, predictive analytics, or other methods to analyze the data and uncover insights.
- Use insights to inform decision-making: Once you have gained wisdom from your data, use those insights to inform decision-making. For example, if analytics reveals that a specific product is not selling well, you may discontinue that product or invest more resources into marketing and promotion.
- Monitor progress and adjust: Finally, monitor progress over time and change your metrics and analytics strategies as needed. Continuously collect and analyze data, use insights to inform decision-making, and monitor progress toward goals to ensure that you are making data-driven decisions and achieving your objectives.
Using metrics and analytics together involves identifying key metrics, collecting and analyzing data, and using analytics to gain insights to inform decision-making and monitor progress over time. By following these steps, businesses can gain a comprehensive understanding of their operations, identify areas for improvement, and make data-driven decisions to achieve their goals.
Best practices for integrating metrics and analytics
Integrating metrics and analytics is critical for businesses that want to understand their operations comprehensively and make data-driven decisions to achieve their goals. Here are some best practices for integrating metrics and analytics effectively:
- Define clear objectives: Define objectives and goals for your metrics and analytics strategy. This might involve identifying the key performance indicators (KPIs) most relevant to your business and setting specific, measurable goals for each metric.
- Align metrics with strategy: Ensure your metrics and analytics align with your overall business strategy. This might involve identifying the metrics most closely tied to your strategic goals and prioritizing those metrics in your data collection and analysis.
- Use data visualization tools: Use data visualization tools to help you communicate insights and findings to stakeholders effectively. Data visualization tools can help you turn complex data into clear, concise visualizations that can be easily understood and communicated.
- Invest in training and development: Invest in training and development for your team to ensure they have the skills and knowledge needed to collect, analyze, and interpret data effectively. This might involve providing training on data analysis tools, statistical methods, and other related topics.
- Continuously monitor and adjust: Monitor your metrics and analytics strategy and adjust your approach as needed. This might involve collecting additional data, refining your analysis methods, or changing your KPIs based on changes in your business strategy.
- Collaborate across departments: To ensure everyone is aligned on your metrics and analytics strategy and working together to achieve your goals. This might involve sharing data and insights across teams, setting up regular meetings to review progress, and promoting a data-driven culture across the organization.
Integrating metrics and analytics involves defining clear objectives, aligning metrics with strategy, using data visualization tools, investing in training and development, continuously monitoring and adjusting, and fostering collaboration across departments. By following these best practices, businesses can comprehensively understand their operations and make data-driven decisions to achieve their goals.
Common mistakes to avoid
While integrating metrics and analytics can be a powerful tool for improving business performance, there are also some common mistakes that businesses should avoid. Here are some common mistakes to watch out for:
- Focusing on the wrong metrics: One common mistake is focusing on metrics not aligned with your business objectives or irrelevant to your key performance indicators (KPIs). Ensure that the metrics you track are directly tied to your strategic goals.
- Collecting too much data: It can be overwhelming and make it difficult to identify the most relevant insights. Be strategic about the data you collect, and focus on collecting data directly tied to your KPIs.
- Failing to analyze the data: Collecting data is just the first step. Failing to analyze the data effectively can lead to missed opportunities and ineffective decision-making. Use analytics tools to help you gain insights from your data.
- Relying too heavily on historical data: Historical data can be a useful tool, but relying too heavily on it can make it difficult to respond to changing market conditions or new opportunities. Ensure you also collect and analyze real-time data to stay ahead of the curve.
- Failing to communicate insights effectively: Insights gained from metrics and analytics are only valuable if communicated effectively to stakeholders. Use data visualization tools and other communication methods to help you effectively communicate insights and findings.
- Ignoring context: Metrics and analytics are only one piece of the puzzle. Ensure you also consider the broader context, such as market trends, industry developments, and other external factors that may impact your business performance.
Integrating metrics and analytics can be a powerful tool for improving business performance. Still, it’s important to avoid common mistakes such as focusing on the wrong metrics, collecting too much data, failing to analyze the data, relying too heavily on historical data, failing to communicate insights effectively, and ignoring context. By avoiding these mistakes, businesses can comprehensively understand their operations and make data-driven decisions to achieve their goals.
Conclusion
Final thoughts on how to use metrics and analytics for business success
Metrics and analytics can be powerful tools for businesses seeking success in today’s competitive landscape. By leveraging metrics and analytics effectively, companies can gain a comprehensive understanding of their operations, identify areas for improvement, and make data-driven decisions to optimize performance and achieve their goals.
To use metrics and analytics effectively for business success, it’s essential to define clear objectives and align your metrics and analytics strategy with your overall business strategy. Ensure you focus on the most relevant metrics and collect data directly tied to your key performance indicators (KPIs).
Once you have collected data, use analytics tools to gain insights and identify patterns and trends in the data. Use these insights to inform decision-making and optimize performance. Ensure you continuously monitor your metrics and analytics strategy and adjust your approach.
Finally, invest in training and development for your team to ensure they have the skills and knowledge to collect, analyze, and interpret data effectively. Fostering a data-driven culture across the organization can help ensure everyone is aligned on your metrics and analytics strategy and working together to achieve your goals.
To use metrics and analytics for business success, businesses should define clear objectives, align their metrics and analytics strategy with their overall business strategy, collect relevant data, use analytics tools to gain insights, continuously monitor and adjust, and invest in training and development. By following these best practices, businesses can gain a competitive edge and achieve their goals.

FAQs
What is data-driven decision-making?
Data-driven decision-making is decisions based on empirical evidence and data rather than intuition, anecdotal evidence, or personal experience. Data is analyzed and interpreted in data-driven decision-making to identify patterns, insights, and trends that inform decision-making.
The data-driven decision-making process typically involves several steps, including identifying the problem or decision to be made, defining the data needed to inform the decision, collecting and analyzing the data, and using the insights gained from the data to inform the decision.
Data-driven decision-making is increasingly important in today’s business environment, as businesses collect and generate vast amounts of data from various sources. By leveraging this data effectively, companies can gain a competitive edge and make more informed decisions based on objective, data-driven evidence.
Data-driven decision-making can be used in various contexts, including marketing, sales, finance, operations, and human resources. It can help businesses optimize performance, improve customer satisfaction, reduce costs, and identify new opportunities for growth and innovation.
Data-driven decision-making is based on empirical evidence and data rather than intuition or personal experience. By leveraging data effectively, businesses can gain a competitive edge and make more informed decisions based on objective, data-driven evidence.
How can I gather and analyze customer data?
Gathering and analyzing customer data is an essential process for businesses seeking to optimize performance, improve customer satisfaction, and identify new opportunities for growth and innovation. Here are some steps for gathering and analyzing customer data effectively:
- Define your objectives: Start by defining your objectives for gathering and analyzing customer data. Identify the key questions you want to answer and the most relevant metrics to your business and goals.
- Collect data from multiple sources: To gather customer data, you can use various sources such as customer surveys, website analytics, social media analytics, or customer feedback forms. Collect data from multiple sources to comprehensively view customer behavior and preferences.
- Organize and clean the data: Once you have collected data, organize and clean the data to remove duplicates, inconsistencies, or incomplete records. This will help ensure your analysis is based on accurate and reliable data.
- Analyze the data: Use analytics tools to analyze the data and identify patterns and insights. This might involve data visualization tools, predictive analytics, or other methods to analyze the data and uncover insights.
- Use insights to inform decision-making: Once you have gained wisdom from your data, use those insights to inform decision-making. For example, suppose analytics reveals that many customers struggle to find the products they are looking for on your website. In that case, you could reorganize your website navigation to improve customer experience.
- Monitor and adjust: Finally, monitor customer data over time and adjust your approach as needed. Continuously collect and analyze data, use insights to inform decision-making, and monitor progress toward goals to ensure that you are making data-driven decisions and achieving your objectives.
Gathering and analyzing customer data involves defining objectives, collecting data from multiple sources, organizing and cleaning the data, analyzing the data, using insights to inform decision-making, and monitoring and adjusting over time. By following these steps, businesses can comprehensively understand their customers and make data-driven decisions to optimize performance and achieve their goals.
What are KPIs, and how do I set them?
KPIs (Key Performance Indicators) are measurable values that help businesses track progress toward specific goals or objectives. KPIs are typically used to evaluate the success of a particular project or initiative or to follow the overall performance of a business or department.
To set KPIs effectively, follow these steps:
- Define your objectives: Start by defining the goals that you want to achieve. These objectives should be specific, measurable, achievable, relevant, and time-bound (SMART).
- Identify relevant metrics: Identify the most relevant to your objectives. These metrics should be closely tied to your goals and objectives and provide actionable insights to help you track progress.
- Set specific targets: Set clear targets for each metric based on your objectives. These targets should be challenging yet achievable and should be based on historical data, industry benchmarks, or other relevant factors.
- Assign responsibility: Assign responsibility for each KPI to a specific person or team. This will help ensure everyone is aligned on the goals and objectives and will help ensure accountability for achieving the targets.
- Monitor progress: Monitor progress towards your KPIs regularly. Use data visualization tools or other methods to help you track progress and identify areas for improvement.
- Adjust as needed: Finally, adjust your KPIs based on changes in your business strategy or other factors. Continuously monitor progress towards your objectives and adjust your approach as needed to ensure that you are making progress towards your goals.
To set KPIs effectively, define your objectives, identify relevant metrics, set specific targets, assign responsibility, monitor progress, and adjust as needed. By setting KPIs effectively, businesses can track progress toward their objectives and make data-driven decisions to achieve their goals.
How can I measure the effectiveness of my marketing campaigns?
Measuring the effectiveness of marketing campaigns is important for businesses seeking to optimize performance, improve customer engagement, and maximize return on investment (ROI). Here are some steps for measuring the effectiveness of your marketing campaigns:
- Define your objectives: Start by defining your objectives for the marketing campaign. These objectives should be specific, measurable, achievable, relevant, and time-bound (SMART). Identify the key performance indicators (KPIs) most closely tied to your objectives.
- Collect data: Collect data on your marketing campaign from multiple sources. This might include website analytics, social media analytics, email marketing analytics, or customer feedback surveys. Ensure you are collecting data on the KPIs most relevant to your objectives.
- Analyze the data: Use analytics tools to analyze the data and identify patterns and insights. This might involve data visualization tools, predictive analytics, or other methods to analyze the data and uncover insights.
- Compare with benchmarks: Compare your KPIs with industry benchmarks or historical data to better understand how your campaign performs relative to other campaigns in your industry or your past campaigns.
- Use insights to inform decision-making: Use the insights gained from your analysis to inform decision-making. For example, if analytics reveals that a specific marketing channel is not performing as well as others, you might allocate more resources to other channels.
- Continuously monitor and adjust: Monitor your marketing campaign’s performance and adjust your approach as needed. Use data to inform decision-making and change your strategy to optimize performance.
In summary, measuring the effectiveness of marketing campaigns involves defining objectives, collecting data, analyzing the data, comparing with benchmarks, using insights to inform decision-making, and continuously monitoring and adjusting. By following these steps, businesses can better understand the effectiveness of their marketing campaigns and make data-driven decisions to optimize performance and achieve their goals.
What are some common analytics tools and platforms?
There are many analytics tools and platforms available to businesses today. Here are some of the most common ones:
- Google Analytics: Google Analytics is a free web analytics service offered by Google that tracks and reports website traffic. It can track website performance, user behavior, and conversion rates.
- Adobe Analytics: Adobe Analytics is a web analytics service that provides real-time analytics, marketing automation, and predictive analytics capabilities. It can track website performance, user behavior, and conversion rates.
- IBM Cognos Analytics: IBM Cognos Analytics is a business intelligence and analytics platform that provides dashboards, reports, and visualizations to help businesses gain insights from their data.
- Tableau: Tableau is a data visualization tool that allows businesses to create interactive visualizations and dashboards to gain insights from their data.
- Power BI: Power BI is a business analytics service provided by Microsoft that provides interactive visualizations and business intelligence capabilities.
- SAS Analytics: SAS Analytics is a business analytics and intelligence platform with advanced analytics, data mining, and predictive modeling capabilities.
- Mixpanel: Mixpanel is an analytics tool that provides real-time user analytics and engagement metrics to help businesses track and optimize user behavior and conversion rates.
- Salesforce Analytics Cloud: Salesforce Analytics Cloud is a cloud-based analytics platform that provides dashboards, reports, and insights to help businesses gain insights from their customer data.
In summary, many analytics tools and platforms are available to businesses today. These tools and platforms provide powerful capabilities for tracking and analyzing data, gaining insights, and making data-driven decisions to optimize performance and achieve business objectives.