Business analytics is an essential component of modern organizations. It helps businesses make informed decisions, gain a competitive edge, and improve their bottom line. However, implementing business analytics can be challenging, especially if you don’t have a standard operating procedure (SOP) in place.
A standard operating procedure is a documented process that outlines the steps to be followed in a particular task or activity. In the case of business analytics, an SOP can help you streamline your analytics processes, ensure consistency, and improve the accuracy and reliability of your data. In this article, we’ll explore the best practices and tips for developing a standard operating procedure for business analytics.
What is the standard operating procedure for business analytics, and why is it important?
A Standard Operating Procedure (SOP) for business analytics is a set of documented procedures and guidelines that define how data is collected, processed, analyzed, and reported consistently and reliably. Having an SOP for business analytics is crucial for several reasons.
- First, it ensures that all organizational stakeholders follow the same protocols, leading to standardized and more accurate results. This makes it easier for team members to understand and collaborate on data analysis, ultimately leading to better decision-making.
- Second, an SOP helps to reduce errors, eliminate biases, and improve the overall quality of data analysis. It provides a framework for data collection and analysis that helps ensure the results’ consistency and validity.
- Finally, an SOP ensures compliance with regulatory requirements and industry standards. By following documented procedures, organizations can avoid costly mistakes and mitigate risks associated with data breaches or non-compliance.
A standard operating procedure for business analytics is essential for ensuring accurate and reliable data analysis, improving decision-making, and mitigating risks associated with non-compliance or errors in data analysis.
Why is the standard operating procedure for business analytics important for data-driven decision-making?
A Standard Operating Procedure (SOP) for business analytics is essential for data-driven decision-making because it ensures that data is collected, processed, analyzed, and reported consistently and reliably. This consistency and reliability are critical when making data-driven decisions as it helps to eliminate biases and errors that can lead to poor decision-making.
An SOP for business analytics provides a clear framework for collecting, analyzing, and reporting data. It outlines the steps that should be taken, the tools that should be used, and the quality standards that should be met. This consistency ensures that the data is accurate, complete, and reliable and can be used to make informed decisions.
Furthermore, an SOP for business analytics helps to establish a common language and understanding of data analysis within an organization. This helps ensure everyone is working towards the same goals, using the same metrics, and following the same procedures. This makes it easier to collaborate on data analysis and to communicate findings and insights across teams and departments.
Having an SOP for business analytics is essential for data-driven decision-making as it helps to ensure consistency, accuracy, and reliability in data analysis. This, in turn, leads to better decision-making and helps organizations to achieve their business objectives.
What are some common challenges of using standard operating procedures for business analytics?
Implementing and adhering to a Standard Operating Procedure (SOP) for business analytics can be challenging for organizations. Some of the common challenges that organizations face include
- Resistance to change: Employees may need to change how they have collected, processed, and analyzed data. Getting everyone on board with new procedures and guidelines can take time.
- Resource constraints: Creating and implementing an SOP requires resources, including time, money, and expertise. Organizations may need help in allocating resources toward this effort.
- Lack of clarity: The SOP should provide clear data collection, analysis, and reporting guidelines. If it is clear and well documented, employees may be able to follow it effectively.
- Data quality issues: If data is incomplete or inaccurate, it can undermine the effectiveness of the SOP. Ensuring that the data being used is high quality and that any issues are addressed promptly is important.
- Training: Employees must be trained on the new SOP to ensure they understand the procedures and can use the tools effectively.
- Flexibility: The SOP should be flexible enough to accommodate changes in data sources, tools, or business needs.
While implementing an SOP for business analytics can lead to improved decision-making and better outcomes, there are some challenges that organizations need to be aware of and address proactively. Organizations can reap the benefits of a well-designed and implemented SOP for business analytics by addressing these challenges.
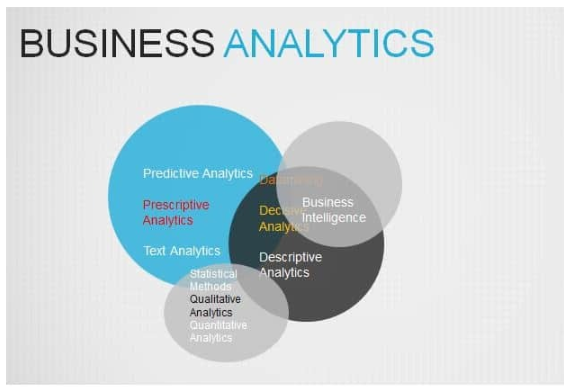
Key Components of Business Analytics SOP
A Standard Operating Procedure (SOP) for business analytics typically includes the following key components:
- Purpose and scope: This section outlines the objectives of the SOP, the processes and procedures it covers, and the roles and responsibilities of those involved in implementing the SOP.
- Data governance: This section outlines the policies and procedures for managing data, including data quality standards, access, and security.
- Data collection: This section outlines the procedures for collecting data, including data sources, data collection methods, and data validation procedures.
- Data processing and analysis: This section outlines the procedures for processing and analyzing data, including cleaning, transformation, and statistical analysis.
- Reporting and visualization: This section outlines the procedures for reporting and visualizing data, including the tools and techniques used to present data in a meaningful and actionable way.
- Quality assurance and control: This section outlines the procedures for ensuring data quality and analysis, including data validation and quality control procedures.
- Change management: This section outlines the procedures for making changes to the SOP, including identifying and approving changes, communicating changes to stakeholders, and retraining employees on the updated procedures.
- Training and documentation: This section outlines the training requirements for employees involved in implementing the SOP and the documentation requirements for documenting procedures and tracking changes to the SOP.
A well-designed SOP for business analytics should include all of the key components outlined above to ensure that data is collected, processed, analyzed, and reported consistently and reliably.
Data collection and storage procedures
Data collection and storage procedures are an essential component of a Standard Operating Procedure (SOP) for business analytics. Here are some key considerations for designing effective data collection and storage procedures:
- Data sources: The first step is identifying the data sources used for analysis. This may include internal data sources (such as transactional or customer data) or external data sources (such as public data sources or data obtained from third-party providers).
- Data collection methods: Once the data sources have been identified, the next step is to determine the data collection methods. This may include manual data entry, automated data feeds, or other methods.
- Data validation: It is important to validate the data before storing it to ensure that it is accurate, complete, and consistent. This may involve performing data quality checks or using data validation tools.
- Data storage: The data should be stored in a secure and organized manner. This may include using a centralized data repository or a data warehouse and implementing data security measures such as access controls and data encryption.
- Data retention: It is important to establish policies and procedures for retaining data, including the length of time data should be stored and when it should be deleted or archived.
- Data documentation: It is essential to document the data collection and storage procedures, including the data sources, data collection methods, data validation procedures, data storage locations, and retention policies.
Effective data collection and storage procedures are essential for ensuring that data is accurate, complete, and secure and can be used for reliable data analysis. By following the procedures outlined in the SOP, organizations can ensure that data is collected, processed, and stored consistently and reliably.
Data cleaning and preprocessing procedures
Data cleaning and preprocessing procedures are critical components of a Standard Operating Procedure (SOP) for business analytics. Here are some key considerations for designing effective data cleaning and preprocessing procedures:
- Data profiling: The first step is to profile the data to identify any missing values, outliers, or inconsistencies. This may involve using data profiling tools or manually reviewing the data.
- Data cleaning: Once the data has been profiled, the next step is to clean the data by addressing any missing values, outliers, or inconsistencies. This may involve imputing missing values, removing outliers, or transforming the data.
- Data transformation: In some cases, it may be necessary to transform the data to make it suitable for analysis. This may involve normalizing or standardizing the data, converting data types, or creating new variables.
- Data integration: If data is coming from multiple sources, it may need to be integrated into a single dataset. This may involve merging datasets or creating new variables based on the data from multiple sources.
- Data sampling: In some cases, it may be necessary to sample the data to reduce the size of the dataset or to select a representative subset of the data.
- Data splitting: If the data will be used for machine learning or other predictive modeling, it may be necessary to split the data into training and testing datasets.
- Data documentation: It is important to document the data cleaning and preprocessing procedures, including any transformations, integrations, sampling, or splitting that was done.
Effective data cleaning and preprocessing procedures are essential for ensuring that data is accurate, complete, and suitable for analysis. By following the procedures outlined in the SOP, organizations can ensure that data is cleaned and preprocessed in a consistent and reliable manner, leading to better data analysis and decision-making.
Data analysis and modeling procedures
Data analysis and modeling procedures are important components of a Standard Operating Procedure (SOP) for business analytics. Here are some key considerations for designing effective data analysis and modeling procedures:
- Data exploration: The first step is to explore the data to identify any patterns, trends, or relationships that may exist. This may involve using descriptive statistics or data visualization tools.
- Data preparation: Once the data has been explored, the next step is to prepare the data for analysis. This may involve creating new variables, transforming the data, or normalizing the data.
- Data analysis: The next step is to analyze the data once the data has been prepared. This may involve statistical methods, machine learning algorithms, or other analytical techniques.
- Model development: If the data analysis involves building models, the next step is to develop the models. This may involve selecting an appropriate modeling technique, defining the model parameters, and tuning the model to achieve the best performance.
- Model validation: Once the models have been developed, the next step is to validate them to ensure they are accurate and reliable. This may involve using validation techniques such as cross-validation or holdout validation.
- Results interpretation: Once the models have been validated, the next step is interpreting the results. This may involve identifying the key drivers of the results, evaluating the model performance, or assessing the impact of the results on business objectives.
- Documentation: It is essential to document the data analysis and modeling procedures, including the techniques used, the models developed, and the results obtained.
Effective data analysis and modeling procedures are essential for turning data into insights and actionable recommendations. By following the procedures outlined in the SOP, organizations can ensure that data is analyzed and modeled consistently and reliably, leading to better decision-making and improved business outcomes.
Reporting and visualization procedures
Reporting and visualization procedures are important components of a Standard Operating Procedure (SOP) for business analytics. Here are some key considerations for designing effective reporting and visualization procedures:
- Audience identification: The first step is identifying the audience for the reports and visualizations. This may include stakeholders such as executives, managers, or front-line staff.
- Key performance indicators (KPIs): Once the audience has been identified, the next step is to define the key performance indicators (KPIs) that will be used to measure performance. This may involve selecting the most important metrics, setting targets, and defining the frequency of reporting.
- Report and visualization design: Once the KPIs have been defined, the next step is to design the reports and visualizations. This may involve selecting the appropriate chart type, designing the layout, and choosing the appropriate colors and font sizes.
- Data integration: The reports and visualizations may need to integrate data from multiple sources, which may require the use of data integration tools or the development of custom scripts.
- Automation: To ensure that reports and visualizations are produced promptly and consistently, it may be necessary to automate the process. This may involve the use of scheduling tools or the development of custom scripts.
- Quality assurance: Ensuring that the reports and visualizations are accurate, complete, and reliable is important. This may involve implementing quality assurance procedures such as data validation or review by multiple stakeholders.
- Documentation: It is important to document the reporting and visualization procedures, including the KPIs used, the report and visualization design, and any automation or quality assurance procedures.
Effective reporting and visualization procedures are essential for communicating insights and recommendations to stakeholders. By following the procedures outlined in the SOP, organizations can ensure that reports and visualizations are produced consistently and reliably, leading to better decision-making and improved business outcomes.
Examples of each component
Sure, here are some examples of each component in a Standard Operating Procedure (SOP) for business analytics:
- Purpose and scope: To establish a standard methodology for data collection, processing, and analysis that ensures accuracy and consistency across the organization.
- Data governance: All data collected must adhere to the data quality standards outlined in the SOP, and access to data must be controlled and monitored.
- Data collection: All data must be collected using standardized methods and tools from approved sources.
- Data processing and analysis: All data must be cleaned, transformed, and analyzed using approved methods and tools, and all analytical methods must be documented.
- Reporting and visualization: All reports and visualizations must be designed to communicate insights and recommendations to specific audiences and must adhere to the visual design standards outlined in the SOP.
- Quality assurance and control: All data and analysis must be validated using approved methods and tools, and quality assurance procedures must be documented.
- Change management: Any changes to the SOP must be approved by the appropriate stakeholders, and all changes must be documented and communicated to affected parties.
- Training and documentation: All employees involved in data collection, processing, and analysis must be trained on the SOP, and all procedures must be documented and available for reference.
These are just some examples of the components that may be included in an SOP for business analytics. The specific components will depend on the organization’s specific needs and requirements.

Best Practices for Developing and Implementing Business Analytics SOP
Developing and implementing a Standard Operating Procedure (SOP) for business analytics can be complex and challenging. Here are some best practices to remember when developing and implementing an SOP for business analytics:
- Define clear goals and objectives: The first step in developing an SOP for business analytics is to define clear goals and objectives. This will help to ensure that the SOP aligns with the organization’s overall strategy and business objectives.
- Involve key stakeholders: It is important to involve key stakeholders in developing and implementing the SOP. This may include managers, analysts, and IT professionals.
- Use a structured approach: The development and implementation of the SOP should follow a structured approach that includes clear documentation, testing, and validation procedures.
- Prioritize data quality: The SOP should prioritize data quality, including validation and quality control procedures. This will help to ensure that the data used for analysis is accurate and reliable.
- Train employees: All employees involved in data collection, processing, and analysis should be trained on the SOP. This will help ensure the procedures are followed consistently and that the results are reliable.
- Monitor and review: The SOP should be monitored and reviewed regularly to ensure that it remains up-to-date and relevant. This may include updating procedures, revising documentation, or incorporating new technologies or data sources.
- Foster a culture of continuous improvement: Developing and implementing an SOP for business analytics is an ongoing process. Organizations should strive to foster a culture of continuous improvement, encouraging employees to suggest improvements to the SOP and incorporating feedback into future updates.
Developing and implementing an SOP for business analytics requires careful planning, documentation, and training. By following best practices, organizations can ensure that the SOP aligns with their business objectives and helps to drive better decision-making and improved business outcomes.
Identifying clear business goals and objectives
Identifying clear business goals and objectives is a critical first step in developing a Standard Operating Procedure (SOP) for business analytics. Here are some best practices for identifying clear business goals and objectives:
- Involve key stakeholders: It is important to involve key stakeholders in identifying them. This may include managers, analysts, and subject matter experts.
- Align with overall business strategy: The business goals and objectives should align with the organization’s overall business strategy. This will help to ensure that the SOP supports the organization’s strategic objectives.
- Use a structured approach: Identifying business goals and objectives should follow a structured approach that includes clear documentation and validation procedures.
- Prioritize key metrics: The business goals and objectives should prioritize key metrics important to the organization’s success. This may include revenue growth, customer satisfaction, or operational efficiency.
- Define specific targets: The business goals and objectives should include specific targets that can be measured and tracked over time. This will ensure that progress toward the goals can be monitored and evaluated.
- Incorporate feedback: Identifying business goals and objectives should be iterative, incorporating feedback from stakeholders and subject matter experts.
- Monitor and review: The business goals and objectives should be monitored and reviewed regularly to ensure they remain relevant and aligned with the organization’s strategic objectives.
Identifying clear business goals and objectives is essential in developing an SOP for business analytics. By following best practices and involving key stakeholders, organizations can ensure that the SOP supports their strategic objectives and helps to drive better decision-making and improved business outcomes.
Assigning roles and responsibilities for data analysis
Assigning roles and responsibilities is an essential component of a Standard Operating Procedure (SOP) for business analytics. Here are some best practices for assigning roles and responsibilities for data analysis:
- Define the scope of analysis: The first step in assigning roles and responsibilities is to define the scope of the analysis. This may include the data sources to be used, the analytical techniques to be employed, and the expected outcomes.
- Identify key stakeholders: The next step is to identify the key stakeholders involved in the analysis. This may include managers, analysts, IT professionals, and subject matter experts.
- Assign roles and responsibilities: Once the stakeholders have been identified, the next step is to assign roles and responsibilities for each individual. This may include data collection, cleaning, preprocessing, analysis, reporting, and visualization.
- Define communication channels: It is essential to define clear communication channels between the stakeholders involved in the analysis. This may include regular meetings, status updates, and procedures for escalating issues or concerns.
- Define quality control procedures: To ensure the accuracy and reliability of the analysis, it is important to define quality control procedures, such as data validation and quality checks, as well as procedures for resolving discrepancies or issues that arise during the analysis.
- Provide training and support: To ensure that stakeholders can perform their roles effectively, it is important to provide training and support, such as training on the analytical tools and techniques to be used, as well as technical support for any issues that arise during the analysis.
- Monitor and evaluate: Once the analysis is complete, it is essential to monitor and evaluate the results to ensure that the objectives of the analysis have been achieved. This may involve reviewing the quality control procedures, evaluating the accuracy of the results, and identifying areas for improvement.
Assigning roles and responsibilities is a critical component of an SOP for business analytics. By following best practices and involving key stakeholders, organizations can ensure that the analysis is performed effectively and efficiently, leading to better decision-making and improved business outcomes.
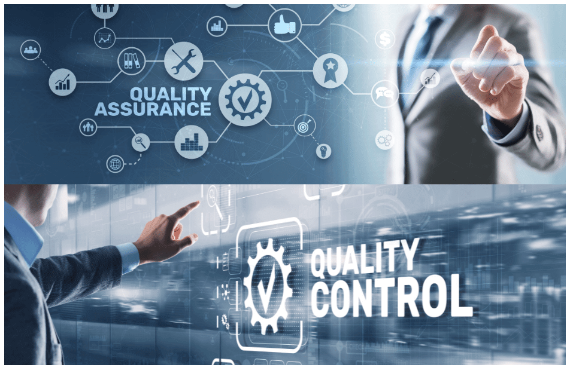
Establishing quality control and assurance processes
Establishing quality control and assurance processes is a critical component of a Standard Operating Procedure (SOP) for business analytics. Here are some best practices for establishing quality control and assurance processes:
- Define quality control procedures: The first step in establishing quality control and assurance processes is to define clear procedures for ensuring the accuracy and reliability of the data used for analysis. This may include data validation, data cleaning, and data preprocessing procedures.
- Establish data quality standards: It is essential to establish clear standards that outline the criteria for acceptable data quality, such as completeness, accuracy, and consistency. These standards should be incorporated into the SOP and communicated to all stakeholders involved in the analysis.
- Use quality control tools: To ensure that the data meets the quality standards outlined in the SOP, it may be necessary to use quality control tools such as data validation software, data profiling tools, or statistical quality control techniques.
- Define quality assurance procedures: Quality assurance procedures should be defined to ensure that the analysis is performed consistently and reliably. This may include procedures for reviewing the data and analysis results and procedures for resolving any discrepancies or issues that arise during the analysis.
- Incorporate feedback: The quality control and assurance processes should be iterative, incorporating feedback from stakeholders and subject matter experts. This feedback can improve the quality control and assurance processes over time.
- Monitor and evaluate: The quality control and assurance processes should be monitored and evaluated regularly to ensure they remain effective and efficient. This may involve reviewing the procedures, evaluating the accuracy of the results, and identifying areas for improvement.
- Document the processes: It is essential to document the quality control and assurance processes, including the procedures used, the tools employed, and any issues or challenges encountered. This documentation should be made available to all stakeholders involved in the analysis.
Establishing quality control and assurance processes is essential for ensuring the accuracy and reliability of data used for analysis. By following best practices and incorporating feedback, organizations can ensure that their analysis is performed consistently and reliably, leading to better decision-making and improved business outcomes.
Regularly assessing and optimizing SOP effectiveness
Regularly assessing and optimizing the effectiveness of a Standard Operating Procedure (SOP) for business analytics is critical to ensuring its ongoing success. Here are some best practices for assessing and optimizing the effectiveness of an SOP:
- Define performance metrics: The first step in assessing the effectiveness of an SOP is to define clear performance metrics. This may include metrics related to data quality, analysis accuracy, and decision-making outcomes.
- Collect data: To assess the effectiveness of the SOP, it is essential to collect data on the performance metrics defined in step one. This may involve collecting data from various sources, such as business applications, data warehouses, and analytical tools.
- Analyze data: Once the data has been collected, the next step is to analyze the data to identify trends, patterns, and areas for improvement. This may involve statistical analysis techniques, data visualization tools, or machine learning algorithms.
- Identify areas for optimization: Based on the data analysis, it is essential to identify areas for optimization in the SOP. This may include changes to data collection procedures, analytical techniques, or reporting and visualization procedures.
- Implement changes: Once areas for optimization have been identified, the next step is to implement changes to the SOP. This may involve updating documentation, revising procedures, or providing additional training to stakeholders.
- Monitor and evaluate: After implementing changes, monitoring and evaluating the results is essential to determine their impact on the performance metrics defined in step one. This will help to determine whether the changes have been effective and identify any other areas for optimization.
- Continuously improve: Finally, fostering a culture of continuous improvement is essential, encouraging stakeholders to suggest improvements to the SOP and incorporating feedback into future updates.
Regularly assessing and optimizing the effectiveness of an SOP for business analytics is essential for ensuring that the organization is making data-driven decisions that lead to improved business outcomes. By following best practices for assessing and optimizing the effectiveness of the SOP, organizations can ensure that it remains relevant and effective over time.
Conclusion
Final thoughts on optimizing data analysis through standardization and process improvement
Standardizing data analysis processes through developing a Standard Operating Procedure (SOP) and continuously improving it can lead to several benefits for organizations, such as improved data quality, greater efficiency, and better decision-making. Here are some final thoughts on optimizing data analysis through standardization and process improvement:
- Consistency: Standardizing data analysis processes ensures that they are performed consistently across the organization, leading to more accurate and reliable results.
- Efficiency: Standardized processes are often more efficient, eliminating unnecessary steps and reducing the risk of errors.
- Scalability: Standardized processes can be scaled up or down as needed, making it easier to handle large volumes of data or adjust to changing business requirements.
- Quality: By prioritizing data quality and implementing quality control and assurance procedures, organizations can ensure that the data used for analysis is accurate and reliable, leading to better decision-making outcomes.
- Collaboration: Standardizing data analysis processes can facilitate collaboration between different teams and departments within the organization, leading to a more integrated and cohesive approach to data analysis.
- Continuous improvement: By regularly assessing and optimizing the SOP for business analytics, organizations can ensure that their data analysis processes remain effective and relevant.
Optimizing data analysis through standardization and process improvement is essential for organizations that want to make data-driven decisions and achieve better business outcomes. By following best practices and continuously improving their data analysis processes, organizations can stay ahead of the competition and ensure long-term success.

FAQ's
Q: What is data preprocessing, and why is it important in business analytics?
Data preprocessing is the process of preparing and cleaning raw data in order to make it suitable for analysis. It is an essential step in business analytics as it helps to ensure that the data used for analysis is accurate, complete, and consistent. Here are some reasons why data preprocessing is important in business analytics:
- Data quality: Preprocessing helps to ensure that the data used for analysis is of high quality, with missing or inaccurate data removed or corrected.
- Consistency: Preprocessing helps ensure the data is consistent, with any variations or inconsistencies corrected or standardized.
- Analysis efficiency: Preprocessing can make the data analysis process more efficient by reducing the time and effort required to clean and prepare the data.
- Better decision-making: Preprocessing helps to ensure that the data used for analysis is reliable, leading to better decision-making outcomes.
- Compatibility: Preprocessing can help to ensure that the data is compatible with the tools and techniques used for analysis, making it easier to generate insights and recommendations.
- Reduction of errors: Preprocessing can help to reduce the risk of errors and biases in the analysis, leading to more accurate and reliable results.
Data preprocessing is an essential step in business analytics that helps to ensure the accuracy, completeness, and consistency of the data used for analysis. Organizations can make more informed and data-driven decisions by performing data preprocessing, leading to better business outcomes.
Q: How can I effectively report and visualize data insights to stakeholders in my organization?
Reporting and visualization are essential components of business analytics, as they enable stakeholders to understand and interpret data insights in a clear and actionable way. Here are some best practices for effective reporting and visualizing data insights to stakeholders:
- Know your audience: The first step in effective reporting and visualization is to know your audience. This will help you to tailor your reports and visualizations to their needs and interests.
- Keep it simple: Keep reports and visualizations simple and understandable. Use clear, concise language and avoid unnecessary jargon or technical terms.
- Use appropriate visualization techniques: Choose the appropriate visualization technique based on the type of data and the insights you want to convey. For example, use bar charts for comparing values, line charts to show trends over time, and scatter plots to examine relationships between variables.
- Highlight key insights: Focus on the most important insights and findings, and use visual cues such as color or size to highlight them.
- Provide context: Provide context for the data, such as the period, source, or relevant industry benchmarks, to help stakeholders interpret the insights.
- Incorporate interactive elements: Use interactive elements such as drill-downs, filters, or animations to let stakeholders explore the data in more detail and gain deeper insights.
- Follow a consistent format: Use a consistent format for reports and visualizations to make it easier for stakeholders to interpret and compare the data over time.
- Encourage feedback: Encourage feedback from stakeholders to improve the quality and relevance of future reports and visualizations.
Effective reporting and visualization of data insights to stakeholders require technical expertise, communication skills, and an understanding of stakeholder needs. By following best practices and incorporating feedback, organizations can ensure that their data insights are communicated clearly and effectively, leading to better decision-making outcomes.
Q: What are some best practices for data privacy and security in business analytics?
Data privacy and security are critical considerations in business analytics. Here are some best practices for ensuring data privacy and security in business analytics:
- Limit access to data: Limit access to data to only those individuals who need it for analysis. Use appropriate access controls such as passwords, authentication, and authorization mechanisms to restrict access.
- Use encryption: Use encryption technologies to protect data during transmission and storage. This includes using secure data transfer protocols such as HTTPS and encrypting data at rest using technologies such as disk encryption.
- Maintain data integrity: Ensure the integrity of the data by using appropriate data validation and quality control procedures and by keeping backup copies of the data in case of accidental loss or corruption.
- Follow data retention policies: Establish data retention policies that define how long data should be retained and how it should be disposed of when it is no longer needed. This helps to minimize the risk of data breaches or unauthorized access.
- Conduct regular security audits: Regularly conduct security audits to identify potential vulnerabilities or areas of weakness in the data security infrastructure and implement appropriate remediation measures as needed.
- Train employees: Train employees on data privacy and security best practices, including properly handling sensitive data, recognizing and reporting security incidents, and avoiding social engineering attacks.
- Comply with regulations: Ensure compliance with applicable regulations and standards, such as GDPR, HIPAA, or PCI DSS, and any internal policies and procedures related to data privacy and security.
Data privacy and security are critical considerations in business analytics. By following best practices such as limiting access to data, using encryption, maintaining data integrity, following data retention policies, conducting regular security audits, training employees, and complying with regulations, organizations can help to ensure the privacy and security of their data assets and minimize the risk of data breaches or unauthorized access.

Q: How can I optimize my business analytics SOP through the continuous improvement?
Optimizing your business analytics Standard Operating Procedure (SOP) through continuous improvement involves a cyclical process of monitoring, analyzing, and improving the SOP. Here are some steps you can take to optimize your business analytics SOP through continuous improvement:
- Monitor performance: Continuously monitor the performance of your SOP, including data quality, analysis accuracy, and decision-making outcomes, to identify areas for improvement.
- Analyze data: Analyze data on the performance metrics defined in step one to identify trends, patterns, and areas for improvement.
- Identify areas for improvement: Based on the data analysis, identify specific areas for improvement in the SOP, such as data collection, cleaning, preprocessing, accounting, or reporting and visualization procedures.
- Implement changes: Implement changes to the SOP based on the identified areas for improvement. This may involve updating documentation, revising procedures, or providing additional training to stakeholders.
- Monitor and evaluate: Monitor and evaluate the results of the changes to determine their impact on the performance metrics defined in step one. This will help determine whether the changes have been effective and identify further areas for improvement.
- Incorporate feedback: Incorporate feedback from stakeholders and subject matter experts into the continuous improvement process to ensure that the SOP remains relevant and effective over time.
- Document changes: Document the changes made to the SOP, including the reasons for the changes, the procedures used, and any issues or challenges encountered. This documentation should be made available to all stakeholders involved in the analysis.
- Continuously improve: Foster a culture of continuous improvement by encouraging stakeholders to suggest improvements to the SOP and incorporating feedback into future updates.
Optimizing your business analytics SOP through continuous improvement involves a cyclical process of monitoring, analyzing, and improving the SOP. Following these steps ensures that your SOP remains relevant and effective over time, leading to better decision-making outcomes and improved business performance.
Q: What common statistical analysis techniques are used in business analytics SOP?
Statistical analysis techniques are commonly used in business analytics SOP to help analyze and interpret data. Here are some of the most common statistical analysis techniques used in business analytics SOP:
- Descriptive statistics: Descriptive statistics are used to summarize and describe the main features of a dataset, including measures of central tendency (such as mean, median, and mode), measures of dispersion (such as standard deviation and range), and graphical displays (such as histograms and box plots).
- Inferential statistics: Inferential statistics are used to make inferences and predictions about a population based on a sample of data. This includes hypothesis testing, confidence intervals, and regression analysis.
- Time series analysis: Time series analysis is used to analyze time-dependent data, such as sales or stock prices, and to identify patterns and trends over time.
- Predictive modeling: Predictive modeling makes predictions or forecasts based on historical data. This includes techniques such as regression analysis, decision trees, and neural networks.
- Clustering: Clustering groups data points based on similarity or proximity. This includes techniques such as k-means clustering and hierarchical clustering.
- Factor analysis: Factor analysis is used to identify underlying factors or dimensions that explain the variation in a dataset. This includes techniques such as principal component analysis and factor analysis.
- Data mining: Data mining extracts patterns and insights from large datasets using association rules, sequential pattern analysis, and text mining techniques.
In conclusion, statistical analysis techniques are essential to business analytics SOP, as they enable analysts to extract meaningful insights and make informed decisions based on data. By understanding the most common statistical analysis techniques used in business analytics SOP, analysts can choose the appropriate technique for their data and analysis needs.

